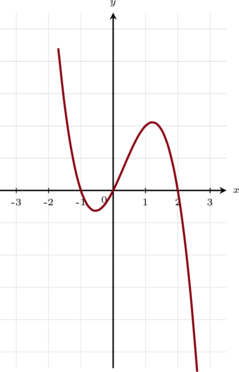
In this page, we will focus on what the derivative tells us about a function and its graph. You will be asked to decide whether statements are true or false and to answer a few additional questions, all while having the graph or either a function  or its derivative
 (or both).
The aim is not simply to calculate a derivative, but to understand what the result means. Remember that the first derivative gives us information about the slope of the tangent line and therefore about whether the function is increasing or decreasing. We also use the first derivative to find extreme points. If the derivative is 0 for any value of  and before and after that value it changes sign, that will be an extreme point.
Use the following ideas to help you:
- If
 , then
 is increasing.
- If
 , then is decreasing.
- If
 , the tangent line is horizontal and the point may be an extreme point.
- At a maximum, the function changes from increasing to decreasing.
- At a minimum, the function changes from decreasing to increasing.
- The derivative at a point tells you the slope of the tangent line at that point.
Take your time and think about what each statement means graphically. You do not always need to calculate something. The examples below will test how much you can understand about a function from the graph or the sign of the derivative, or analyse the behaviour of the function is enough to find the answer.
True or False
Either the graph of  or that of is given. Then, we are given statements to prove or disprove using the information provided. We will see one example where the graph of is given and another where the graph of is given.
Example: The graph of the derivative function of a continuous function is shown below. Assume that is a polynomial function of at least degree 3. Analyze the graph of to evaluate the given statements as True or False.
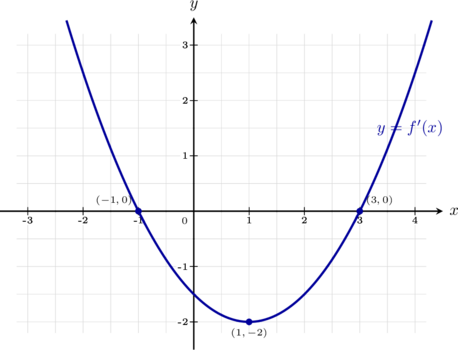
Statements to evaluate:
- The original function is strictly decreasing on the interval
 .
- The original function has a local maximum point at
 .
- At the point where
 , the tangent line to the graph of the original function is completely horizontal.
- At the point where
 , the tangent line to the graph of the original function is completely horizontal.
 . Since a negative derivative indicates a downward-tilted tangent line slope, the original function
 ), so it is a stationary point. Just before
 , which is not zero. Instead, the tangent line to
 .
 . Since the derivative value matches the slope of the tangent line, a slope of exactly
 confirms that the tangent line to
It is very important not to mix and in this process. Let us see another example now.
Example: The graph of a continuous function is shown below. Analyze the visual tracking profile of the curve to evaluate the given statements about its derivative as True or False.
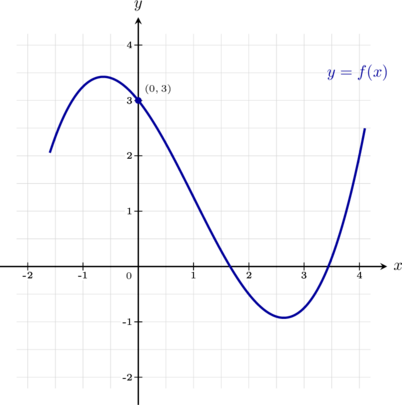
Statements to evaluate:
- The derivative value at
 is positive.
- The derivative value at
 is negative.
- There exists a value
 in the open interval
 such that
 .
- The value of the derivative is exactly zero at some point between and
 .
 .
 .
 and begins turning back upward. At that point, the tangent line becomes completely horizontal, meaning
Graph Matching
Here we are given the same type of task, but disguised. We are given graphs of functions and we are asked to match them to their derivatives.
Example: The graph of a function is given below.
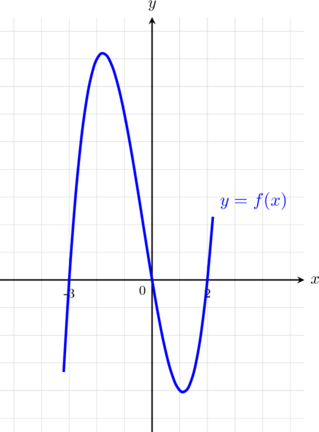
Which of the four candidate graphs below corresponds to its first derivative ? For each option, explain clearly why it is or is not the correct one.
Graph 1
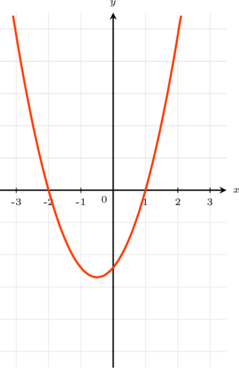
Graph 2
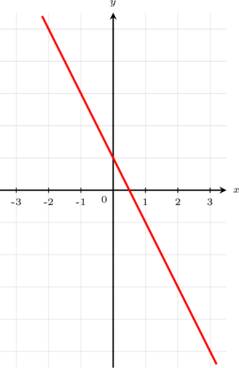
Graph 3
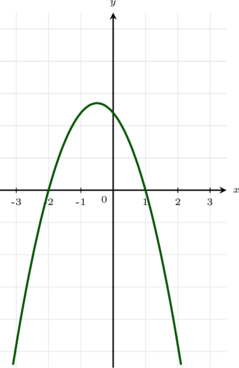
Graph 4
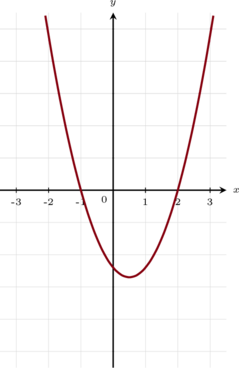
 ) until
 .
 ) between the turning points on the interval
 .
 .
 .
 and then negative. This would imply that our function increases until
Exercises
The graph of the derivative function of a continuous function is shown below. Analyze the graph of to evaluate the given statements as True or False.
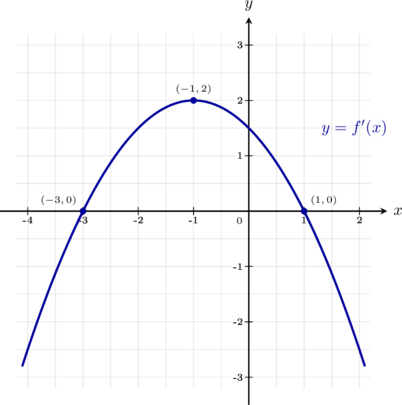
Statements to evaluate:
- The original function is strictly increasing on the open interval
 .
- The original function has a local minimum point located at
 .
- At the point where , the tangent line to the graph of the original function is completely horizontal.
- For all values of
 , the slope of the tangent line to the original function is strictly negative.
The graph of the derivative function of a continuous function is shown below. Analyze the graph of to evaluate the given statements as True or False.
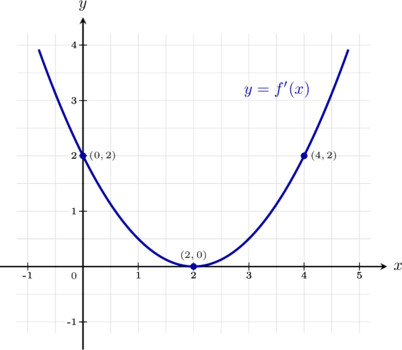
Statements to evaluate:
- The original function has a local extreme point located at .
- The original function is strictly increasing across both the interval
 and the interval
 .
- At the point where , the tangent line to the graph of the original function is parallel to the line
 .
- The graph of the original function contains no horizontal tangent lines anywhere on its domain.
The graph of a continuous function is shown below. Analyze the geometric properties of the curve to evaluate each statement about its derivative as True or False.
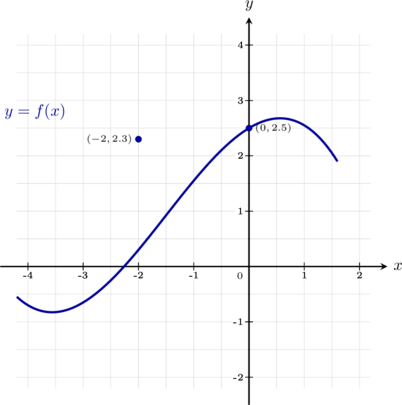
Statements to evaluate:
- The derivative is strictly positive on the entire open interval
 , which means
 for all
 .
- At the point where
 , the tangent line to the curve is tilted downwards from left to right.
- The equation
 has no real solutions inside the open interval
 .
- The function has a stationary point where the tangent line is horizontal somewhere between and .
The graph of a continuous function  is shown below. Analyze the geometric curves and tracking paths to evaluate each statement about its derivative
 as True or False.
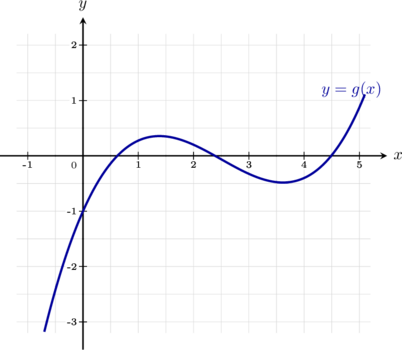
Statements to evaluate:
- The derivative value at is positive (
 ), which corresponds to an upward-sloping tangent line.
- The derivative value at is positive (
 ), because the curve is above the
 threshold line.
- The function is strictly decreasing on the entire interval
 , which means
 on that interval.
- The curve reaches a local maximum value inside the interval
 , meaning
 for some value
 .
The graph below shows the first derivative of a continuous function defined over the interval  .
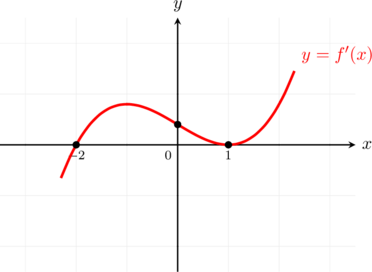
Based purely on this visual graph of , determine whether each of the following five statements is True, False, or if there is Not Enough Information to decide. Be prepared to justify your answers.
has a local minimum at . has a local minimum at . is non-negative for any in the interval  .
The graph of a polynomial function  is shown below. Moving left to right, it decreases until a local minimum at , increases until a local maximum at , decreases until another local minimum at , and increases indefinitely thereafter.
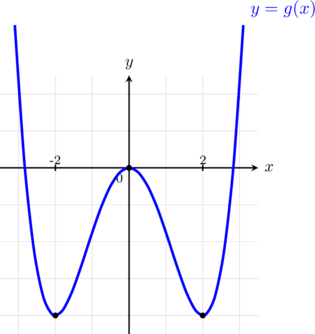
Which of the three cubic candidate graphs below corresponds to its derivative  ? Analyze each option carefully.
Graph A
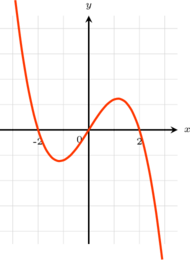
Graph B
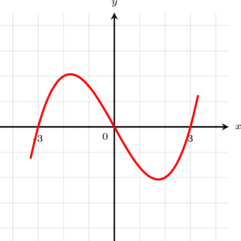
Graph C
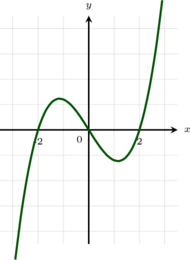
The graph of a continuous function is given below.
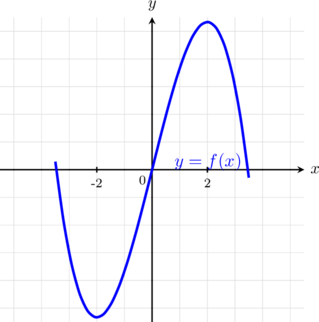
Which of the four candidate graphs below corresponds to its first derivative ? For each option, explain clearly why it is or is not the correct one.
Graph A
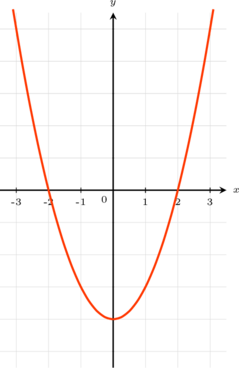
Graph B
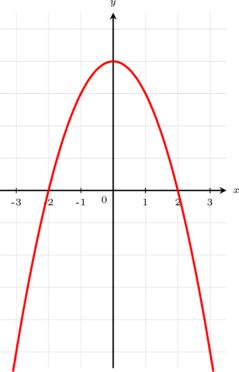
Graph C
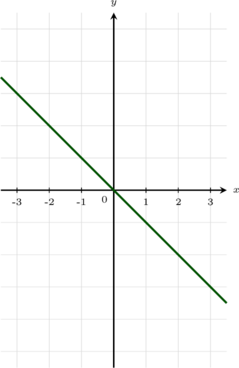
Graph D
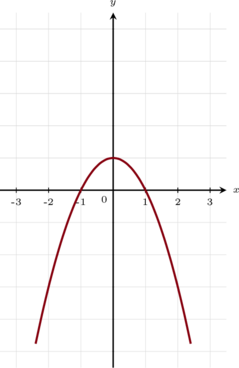
The graph of a continuous function is given below. This function exhibits three distinct turning points (local extrema).
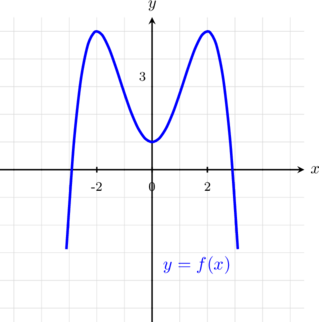
Which of the four candidate graphs below corresponds to its first derivative ? For each option, explain clearly why it is or is not the correct one.
Graph 1
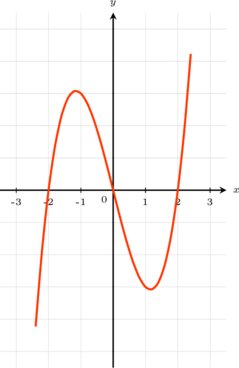
Graph 2
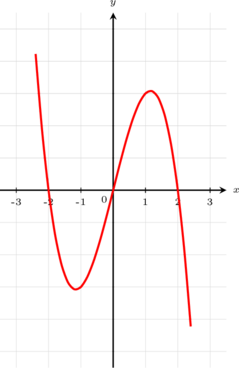
Graph 3
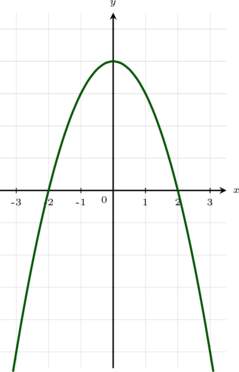
Graph 4