You have already studied probability in S4 and S5. This page and the upcoming sections (except for the last one) are mostly reminders of things you will have seen. The goal is to make sure the basic probabilistic formulas and concepts are clear before we extend them to the final topic of the year, discrete random variables.
Basic Definitions
We begin with the simplest definition, a sample space:
Definition (Sample Space): The sample space of an experiment is the set of all possible outcomes. Formally, it is denoted by the Greek letter Omega ( ) or the capital letter
 , where every distinct, individual result of the experiment represents a single element within this comprehensive set.

An element of this sample space is an outcome. Many elements of this sample space grouped together is called an event.
Example: Determine the sample space for tossing a coin twice, and express the event of getting “at least one Head” in different formats.
 ) or Tails (
 ). The full sample space listing all 4 possible absolute outcomes is:

 ) in Different Ways

Notice how so far we are not talking about probabilities. Depending on the experiment, we can attribute different values to outcomes and events. For example, if the coin is fair (i.e.: every outcome is equally likely), then we have:

 to denote probabilities. We could say
 since the outcome “Heads twice” is (H,H) so we need two sets of brackets, but we typically favour a shorthand notation for simplicity.
A probability is simply a function that takes an outcome or event and returns a number between 0 and 1. More formally
 . Here we are saying that the function takes elements in and returns a number between 0 and 1, including. If the number is 0, the event cannot happen. If the number is 1, it will certainly happen.
Notice also that we do not repeat outcomes in our sample space and we also do not include outcomes whose probabilities are 0. We are trying to express and model a situation in the neatest possible way.
A sample space is an explicit way to write all the outcomes. Experiments that are repeated a lot can make this rather tedious. Therefore, you develop tools in S4 and S5 to represent outcomes more easily and save time.
In particular, you have seen that two events are called:
- Disjoint if they have no outcomes in common.
- Complementary if they have no outcomes in common and together they make the sample space.
- Exhaustive if together (their union) makes the sample space.
- Independent if one happening does not affect the likelihood of the other happening.
We will see some of these definitions more formally and more in detail in the coming pages.
Tree Diagrams
One of the easiest, most comfortable methods to represent outcomes is a tree diagram.
Definition (Tree Diagram): A tree diagram is a visual tool to map out all possible stages of a multi-step experiment. Each branch represents a single choice, action, or outcome at a specific step, creating hierarchical pathways that break down compound events from left to right.
1. Understanding Outcomes:
The full sample space () is determined by tracing individual paths from the starting root node to the final outer tips. Each complete path from start to finish represents one unique, compound outcome in the global set.
2. Calculating Probabilities:
Conditional probabilities are written along each individual branch segment. Two fundamental rules apply when calculating numeric values from the visual system:
- Along a Path (The Multiplication Rule): To find the probability of a single compound outcome, multiply the probabilities along its specific sequence of branches from left to right.
- Across Multiple Paths (The Addition Rule): To find the probability of an event containing several distinct paths, calculate the value of each individual path first, then add those product values together.
The example below will show us how we use a tree diagram fully.
Example: A student tracks their morning commute weather and arrival status. The probability of rain on any given morning is  . If it rains, the probability of being late to school is
 . If it does not rain, the probability of being late drops to
 . Draw a tree diagram and find the probability that the student arrives late.
 Stage 2: Arrival Status)
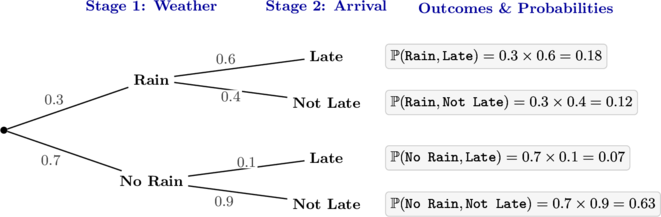

 matches two distinct independent scenarios in our diagram:




 chance (
 ) that the student will arrive late on any given morning.
Notice how we calculated the probability of being late. We covered all the scenarios, namely: “Rain and Late” and “No Rain and Late”. This is an example of the total probability formula, which we will learn on the last page. It is how we divide an event (Late) and calculate its probability by intersecting it with a condition and its complement.
Moreover, if we look at the branch Late at the very top, this is not the outcome “Late”. This is the outcome “Late assuming that it rained”. This is an example of conditional probability, which we will discuss in the next page.
Example: A soccer team plays  sequential tournament matches. The probability that they win any given match is , and the probability that they lose is
 (assume no draws occur and the matches are independent). Find the probability that the team:
- Wins exactly two out of the three matches.
- Wins at least one match.
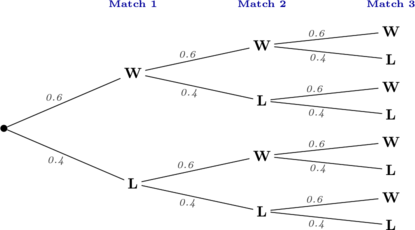
 :




For the last probability, we used the concept of complementary events, which you have seen extensively in S4 and S5. Two events are complementary if one happens if and only if the other does not.
Venn Diagrams
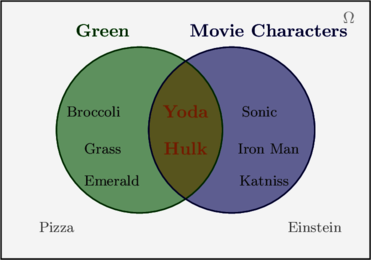
These diagrams group elements into different categories using circles. Two circles intersect if there is an element that belongs to both categories. For example:
The most important part of an exercise involving Venn diagrams is understanding what each section represent and paying special attention to the wording. If a word is there or not it will make a big difference. To be specific, we can think of each section as:
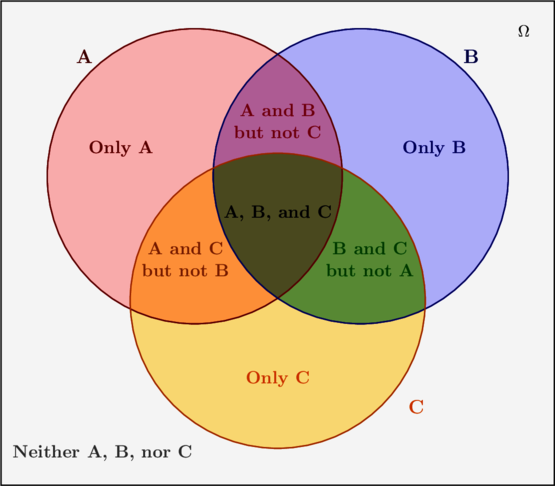
With this in consideration, we can create our own diagrams from instructions by starting from the most specific category to the least specific.
Example: A survey asked  people which subjects they prefer. The results are as follows:
 people like Mathematics (
 ).
 people like Biology (
 ).
 people like Physics (
 ).
 people like both Mathematics and Physics.
- people like both Mathematics and Biology.
 people like both Biology and Physics.
 people like all three subjects.
- people dislike all three subjects.
Tasks:
1. Classify this information using a step-by-step Venn diagram.
2. Calculate the probability that a student chosen at random:
- Likes mathematics and biology, but does not like physics.
- Likes physics assuming that they like biology.
- Does not like biology.
- Likes mathematics assuming that they do not like physics.
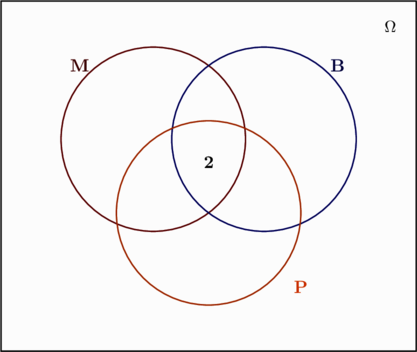


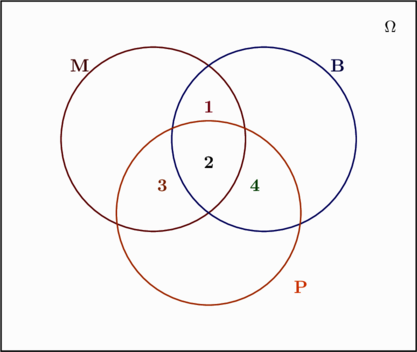



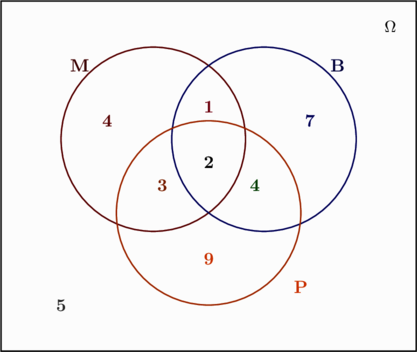
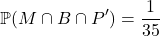
 . We compute each target event size using the values in the completed Venn diagram:
 , which contains exactly
 person.
 like Physics. Therefore


 students. Out of these
 people, those who like Mathematics are found in the regions “Only

Two-Way Tables
Our final method of representation is a two-way table. This is particularly useful when we have two categories and we want to organise the information from each category and combine them.
Example: An electronics repair shop tracks the devices repaired last month by type (Smartphone, Laptop, Tablet) and the primary repair category (Screen, Battery, Software). Below is the incomplete tracking sheet:
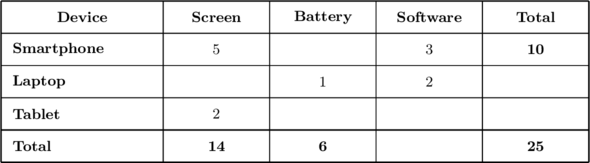
Tasks:
1. Complete the table showing how many devices were repaired in each category last month.
2. If a device repaired last month is chosen at random, what is the likelihood that the device was:
- A screen repair.
- A laptop.
- A software repair on a smartphone.
- A screen repair, assuming it was a tablet.
- A laptop, assuming it required a battery repair.
- A software repair, assuming it was either a smartphone or a laptop.
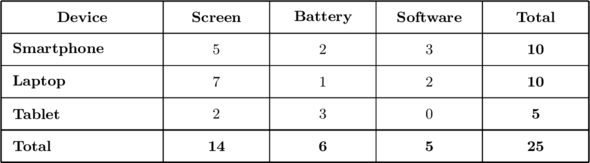
 . We evaluate each case directly from our completed matrix fields:
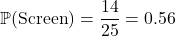

 ) isolates exactly



 units). Within this scope, software tasks equal
 .

Exercise
A box contains red cards and blue cards. Three cards are drawn sequentially one after another without replacement. Construct a tree diagram with changing conditional branch probabilities to find the probability of drawing exactly two red cards.
A diagnostic laboratory evaluates samples. A random sample has a  probability of containing a specific marker. If the marker is present, the test has a
 probability of returning positive. If the marker is missing, the test has a
 probability of returning a false positive. Build a two-stage tree diagram to find the total probability that a randomly chosen sample tests positive.
A basketball player attempts three successive free throws. The probability of making any single shot is  , and missing is . Use a tree diagram to represent the sample space and find the probability that the player misses at most one shot.
A manufacturing line tests three independent electronic components. The probability that an individual component passes inspection is  , and the probability it fails is
 . Draw a tree diagram to map out all pathways and calculate the probability that exactly two components pass.
A marketing survey tracked the streaming subscriptions of  individuals. The data collected is as follows:
 people subscribe to Movie Channel ().
 people subscribe to Sports Network ().
 people subscribe to Documentary Library (
 ).
 people subscribe to both Movie Channel and Sports Network.
 people subscribe to both Movie Channel and Documentary Library.
 people subscribe to both Sports Network and Documentary Library.
 people subscribe to all three platforms.
- people subscribe to none of these platforms.
Tasks:
1. Complete the Venn diagram step by step to represent the distribution.
2. Calculate the probability that a person chosen at random:
- Subscribes to Movie Channel and Documentary Library, but does not subscribe to Sports Network.
- Subscribes to Sports Network assuming that they subscribe to Documentary Library.
- Does not subscribe to Movie Channel.
- Subscribes to Documentary Library assuming that they do not subscribe to Movie Channel.
Step-by-Step Solution Layout:
Part 1: Venn Diagram Steps
• Step 1 (Center): All three platforms = .
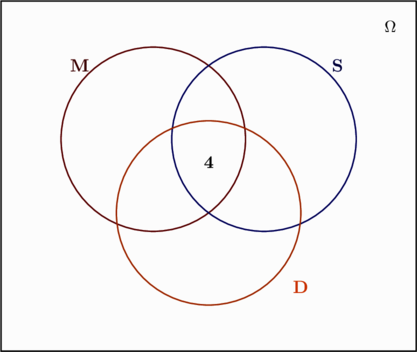
• Step 2 (Double Intersections): Subtract the center value () from the paired sets:
• and only = 
• and only = 
• and only = 
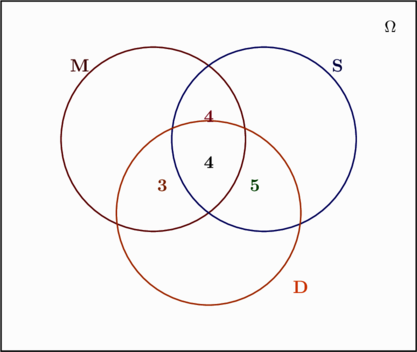
• Step 3 (Single Regions & Exterior): Subtract values inside each circle from its main total:
• Only = 
• Only = 
• Only = 
• Exterior (None) =
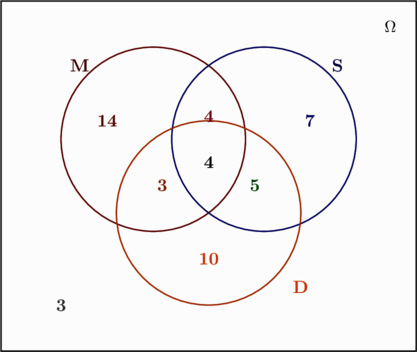
Part 2: Probability Calculations
The total population size is  . Using the completed fields:
a. Movie Channel and Documentary, but not Sports Network:
Matches the region  . From the diagram, this equals .

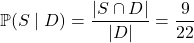
b. Subscribes to Sports Network assuming that they subscribe to Documentary Library:
Condition pool is limited to ( people total). Out of these,  also subscribe to .
c. Does not subscribe to Movie Channel:
Determined via complement of ( people):

d. Subscribes to Documentary Library assuming that they do not subscribe to Movie Channel:
Condition pool is limited to individuals outside , which is  people. Out of these, those in belong to “Only ” () and “Only and ” ():

At a fitness studio, members attend specialized classes.  members do Yoga,
 members do Pilates, and each member attends at least one of these two activities. Represent this information using a Venn diagram and find the likelihood that a randomly-selected member:
- Does both activities.
- Does Yoga but not Pilates.
In a team of  software engineers at a tech startup, use Python,
 use JavaScript, and use neither language. Find the probability that a randomly-selected engineer:
- Uses Python but not JavaScript.
- Uses both Python and JavaScript.
A school library categorizes a sample of newly acquired books by genre (Fiction, Non-Fiction, Biography) and format (Hardcover, Paperback, Audiobook). Complete the following data matrix:
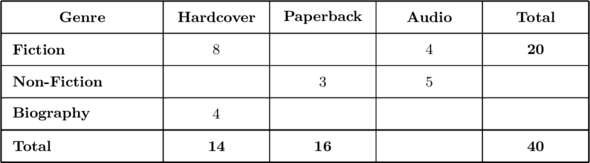
If a book from this tracking set is selected at random, find the likelihood that it was:
- A non-fiction book.
- A paperback biography.
- An audiobook, assuming it is a fiction book.
- A hardcover book, assuming it is either a non-fiction book or a biography.
A local gym analyzes member registration profiles across different age bands (Youth, Adult, Senior) and preferred training environments (Weights, Cardio, Classes). Solve for the empty cells below:
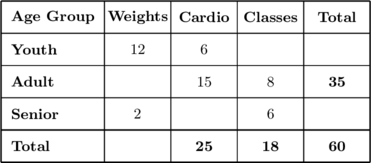
If a registration file is drawn at random from this group, find the probability that the member is:
- Primarily focused on cardio training.
- A senior, assuming they focus on group classes.
- An adult or a senior, assuming they do not focus on weight training.