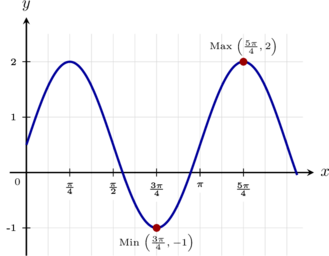
Many real-life situations involve patterns that repeat over time: the height of a tide, the position of a swinging object, the number of daylight hours, or the temperature throughout a day. In maths, we can model these repeating patterns using sinusoidal functions. A general sinusoidal function can be written as:

 and
 each control a different feature of the graph. By understanding what each parameter does, we can move between a graph and its corresponding equation.
In this page, you will learn how to:
- Identify the amplitude, period, phase shift, and vertical shift of a sinusoidal graph.
- Understand how these features are represented by and .
- Determine the values of the parameters from a given graph.
- Use these parameters to construct a sinusoidal model for a periodic situation.
The key idea is that the shape of the graph tells us the values of the parameters. We will therefore focus on reading the important features of a graph and using them systematically to build its equation.
The Role of the Parameters
Below you have the graph of a general sine function  and a modified version of it as
 .
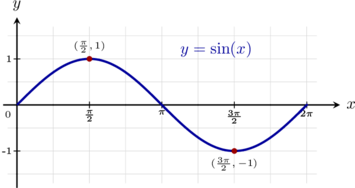
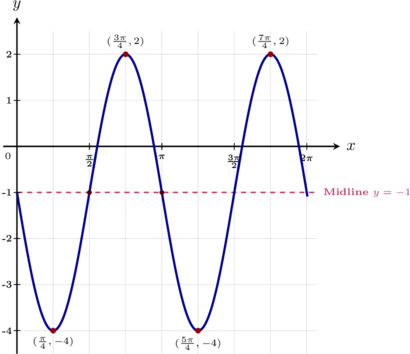
You can see that the changes made to the function are the following: it can be stretched/contracted vertically or horizontally, it can be translated vertically or horizontally. These changes are all indicated by the parameters  and . Let us define them:
Definition (Amplitude): The amplitude of a sine function is a measure of its vertical scaling or intensity. It is defined as half the vertical distance between its maximum value and its minimum value. Mathematically, for a function with a maximum value  and a minimum value
 , the amplitude
 is given by:

So far, so good. Look at the graph of a modified sine function, check out the maximum, the minimum, and conclude the value of .
Definition (Vertical Shift): In a trigonometric function of the form  , the parameter represents the vertical shift of the graph. It displaces the entire wave upwards or downwards relative to the baseline axis, defining the new horizontal midline (axis of symmetry) around which the curve oscillates. Mathematically, it matches the average value of the function and is given by:

This one you can also conclude differently. The typical sine function oscillates between  and
 . Once you know the value of , you can conclude the value of by also looking at the graph. Suppose
 , then the sine function you are looking at should oscillate between
 and
 . If it does not, it has been moved vertically. Simply count how many units it was moved and that will be the value of . If it was moved upwards, is positive. If it was moved downwards, is negative.
Definition (Frequency Parameter  and Period): In a trigonometric function of the form
 , the parameter controls the horizontal scaling (frequency). The Period (
 ) is the horizontal length of one complete cycle before the wave repeats itself. Visually, it is measured as the distance between two consecutive peaks, two consecutive valleys, or matching midline points.
The Period Formula:
The relationship between the frequency parameter (where  ) and the visually measured period is given by:

Visual Measurement on a Graph:
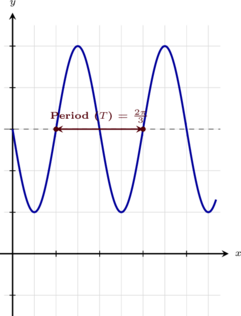
The graph below illustrates a cycle of  . Since
 , the wave cycles faster, and its horizontal period length shrinks from
 down to exactly
 , as marked by the span between the two adjacent peaks:
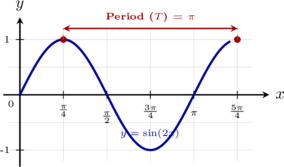
Finally, we understand what  is and how to conclude it:
Definition (Phase Shift Parameter via Midline Intercept): In a trigonometric function of the form , the parameter represents the horizontal phase shift (translation). Geometrically, for the standard sine wave, is measured directly from a graph by identifying the  -coordinate where the wave crosses its horizontal midline (
 ) while travelling upwards (increasing).
Visual Measurement on a Graph:
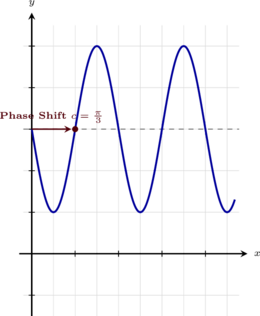
The graph below illustrates a cycle of  . The horizontal midline sits at
 . A standard sine wave normally crosses its baseline at the origin, but this shift moves that exact ascending midline crossing point horizontally to the right by exactly
 units, establishing
 :
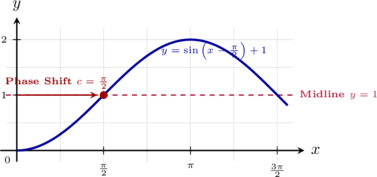
An alternative way to find would be to pick a maximum or a minimum point (both coordinates) and replace them in the formula for  . The value of is replaced by the -coordinate of that max/min point, then is replaced by the
 -coordinate. Since the function is: and we can find
 , and independently, we are left with an equation with . This requires us to know some basic trigonometric ratios, which you have learned in S4 and S5. Basically, we need to know that
 whenever
 and
 whenever
 . Note that two people can get different values of because the function repeats itself.
Concluding the Function from the Graph
In the examples below, we use the definitions we have seen above to find the value of the parameters given the graph of a sine function.
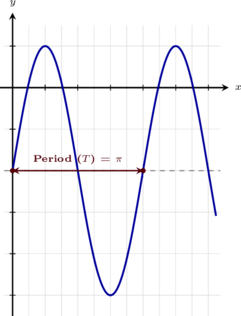
Example: The graph of a periodic trigonometric function of the form  is shown below. Determine the values of parameters , , , and using the geometric information provided on the grid.
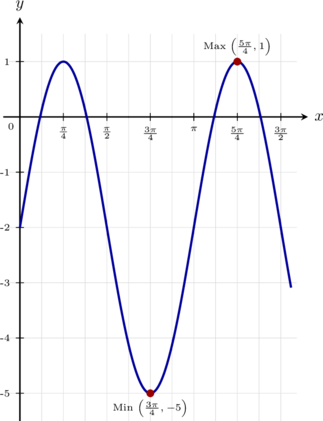
 , and the lowest trough drops to a minimum value of
 . Using the amplitude formula:

 , meaning the graph scales vertically by stretching out

 and
 units (
 and
 ). Thus, the midline and vertical shift is
 .
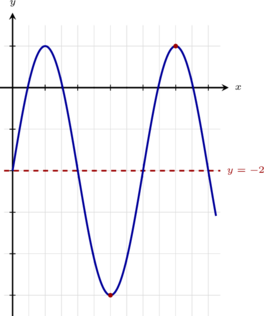
 , we find that a full, single repeating wave pattern begins at
 and finishes its complete cycle exactly at
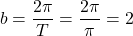
 . Therefore, the measured period is
 . Substituting this value into the standard horizontal frequency formula allows us to solve for
 . Otherwise, we can find the next matching point. This is at
 . Therefore

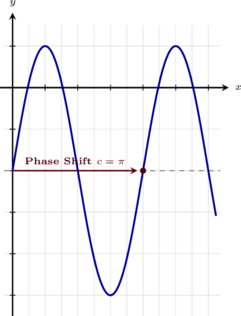

 .
Let us see another example.
Example: The graph of a periodic trigonometric function of the form (where  and ) is shown below. Determine the values of parameters , , , and using the geometric information provided on the grid.
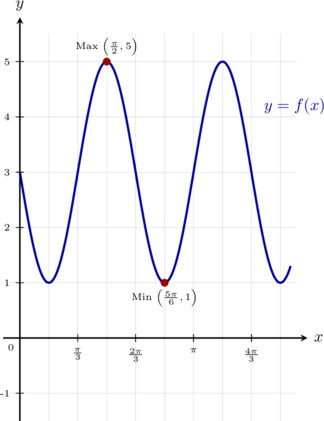
 , and the lowest trough drops to a minimum value of
 . Using the amplitude formula:

 , meaning the graph scales vertically by stretching out

 and
 . Comparing these two profiles shows that every single point has been shifted upward by exactly
 and
 ). Thus, the midline and vertical shift is
 .
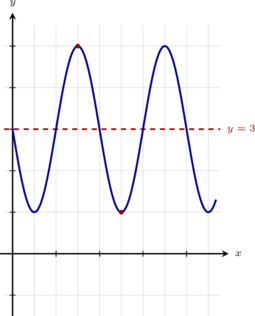
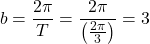
 .
 below:
 .


 .
There are different ways to find as well. Looking at the graph of , we see that it starts from 0 (our “middle reference point), then reaches the max, then 0 again (not the same reference point), then the minimum, and then it repeat itself. This happens all within (the period). However, we can also section the graph accordingly by intervals of a quarter of the period or, in the case of , . That is, the difference between the -coordinates of the maximum and the minimum is always half the period. The difference between the -coordinates of an -intercept and the max/min is always a quarter of the period, and so on. This is an alternative (albeit more complicated) way to understand the period by looking at the graph.
Exercises
The graph of a periodic trigonometric function of the form is shown below. Determine the values of parameters , , , and using the geometric information provided on the grid.
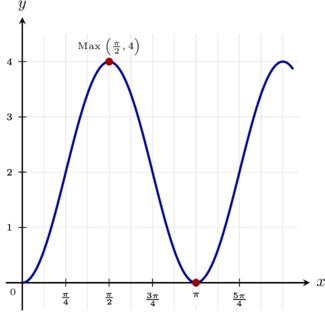
The graph of a periodic trigonometric function of the form is shown below. Determine the values of parameters , , , and using the geometric information provided on the grid.
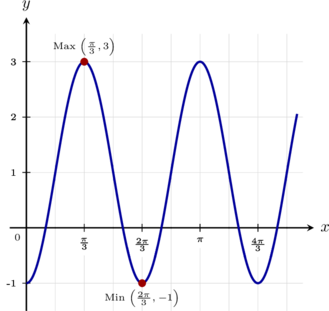
The graph of a periodic trigonometric function of the form is shown below. Determine the values of parameters , , , and using the geometric information provided on the grid.
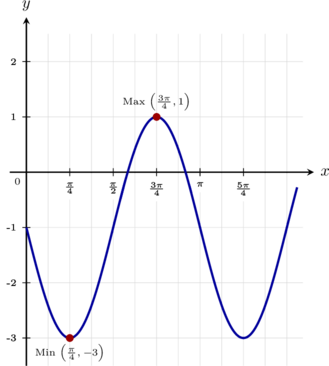
The graph of a periodic trigonometric function of the form is shown below. Determine the values of parameters , , , and using the geometric information provided on the grid.
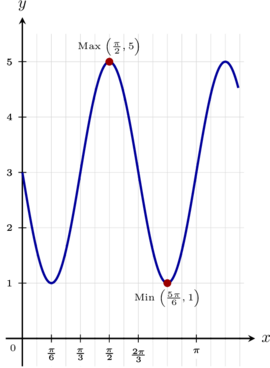
The graph of a periodic trigonometric function of the form is shown below. Determine the values of parameters , , , and using the geometric information provided on the grid.