We finish the analysis unit by discussing sketching logarithmic functions. Recall that to sketch a function we need:
- Domain
- Axes Intercepts
- Asymptotes (horizontal and vertical)
- Extreme Points (and the first derivative)
- Inflection Points (and the second derivative)
Asymptotes of the Logarithmic Function
A horizontal asymptote exists if the limit  exists and is finite. We may not be able to find one of the limits (either
  or
or  ) depending on the domain. We may also have examples where neither of them can be found.
The vertical asymptote is studied at points of discontinuity. In other words, if we have some  we study the limits as
  or
or  . Either of these could result in a vertical asymptote. This is because:
![\[\lim \ln(0^+)=-\infty\text{ and }\lim\ln(\infty)=\infty\]](https://mathematics.lu/wp-content/ql-cache/quicklatex.com-c658e8e3b6ff3046cddf9d3d684b90c4_l3.png "Rendered by QuickLaTeX.com")
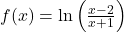
Example: Determine the equations of all vertical and horizontal asymptotes for the composite logarithmic function 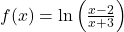 .
.
 ). Therefore, the inner rational argument must satisfy the inequality:
![\[\frac{x-2}{x+3} > 0\]](https://mathematics.lu/wp-content/ql-cache/quicklatex.com-7f3c85fe35ad4295cafc6f346f1a8e91_l3.png "Rendered by QuickLaTeX.com")
 and
and  ). Performing a sign analysis across the intervals reveals that the fraction is positive when both terms have the same sign:
![\[\text{Domain: } (-\infty, -3) \cup (2, \infty)\]](https://mathematics.lu/wp-content/ql-cache/quicklatex.com-984ae02cf5c654c8cfa12a03ac813892_l3.png "Rendered by QuickLaTeX.com")
 occur at the boundary edges of the domain where the inner argument
  approaches
  (causing the logarithm to dive to
  ) or where
  (causing the logarithm to climb to
  ): As
): As  approaches
  from the left side, the numerator approaches
  and the denominator approaches a tiny negative number (
 ). The quotient explodes to positive infinity:
![\[\lim_{x \to -3^-} \left(\frac{x-2}{x+3}\right) = \frac{-5}{0^-} = \infty \implies \lim_{x \to -3^-} \ln\left(\frac{x-2}{x+3}\right) = \infty\]](https://mathematics.lu/wp-content/ql-cache/quicklatex.com-b597dd116d1feb8a10fddfc18aeeabe9_l3.png "Rendered by QuickLaTeX.com")
 ): As
): As  from the right side, the numerator approaches a tiny positive number (
 . The quotient approaches zero from above:
![\[\lim_{x \to 2^+} \left(\frac{x-2}{x+3}\right) = \frac{0^+}{5} = 0^+ \implies \lim_{x \to 2^+} \ln\left(\frac{x-2}{x+3}\right) = -\infty\]](https://mathematics.lu/wp-content/ql-cache/quicklatex.com-75504cfb9207ae5813d01f59a7fc0e07_l3.png "Rendered by QuickLaTeX.com")
 ):
):![\[\lim_{x \to \pm\infty} \left(\frac{x-2}{x+3}\right) = \lim_{x \to \pm\infty} \left(\frac{1 - \frac{2}{x}}{1 + \frac{3}{x}}\right) = \frac{1-0}{1+0} = 1\]](https://mathematics.lu/wp-content/ql-cache/quicklatex.com-9dcbe7fc52cac054e60bd99d79a04c8f_l3.png "Rendered by QuickLaTeX.com")
 , we pass the limit inside the continuous natural logarithm function:
![\[\lim_{x \to \pm\infty} \ln\left(\frac{x-2}{x+3}\right) = \ln(1) = 0\]](https://mathematics.lu/wp-content/ql-cache/quicklatex.com-5b154f9ae83bc347e641a099c2b81599_l3.png "Rendered by QuickLaTeX.com")
 (the
(the Sketching Logarithmic Functions
As we did when sketching general functions, we find everything in the list above and combine it to create the graph.
Example: Conduct a complete curve sketching analysis for the logarithmic function  and include a diagram with its graph.
![\[3x + 9 > 0 \implies 3x > -9 \implies x > -3 \implies \text{Domain: } (-3, \infty)\]](https://mathematics.lu/wp-content/ql-cache/quicklatex.com-bc0ea0020acdbc2748eaecda0575f72a_l3.png "Rendered by QuickLaTeX.com")
 -intercept: Evaluate
  .
.
![\[\implies \ln(3x + 9) = 0 \implies 3x + 9 = 1 \implies x = -\frac{8}{3}\implies \mathbf{\left(-\frac{8}{3}, 0\right)}\]](https://mathematics.lu/wp-content/ql-cache/quicklatex.com-55bd33b235e922376cfefb9c468e528f_l3.png "Rendered by QuickLaTeX.com")
 , the inner linear argument approaches
 ![\[\lim_{x \to -3^+} \ln(3x + 9) = -\infty \implies \text{\textbf{Vertical Asymptote: }} x = -3\]](https://mathematics.lu/wp-content/ql-cache/quicklatex.com-8a7191338406187f0312884acfd31195_l3.png "Rendered by QuickLaTeX.com")
 :
:
![\[\lim_{x \to \infty} \ln(3x + 9) = \infty\]](https://mathematics.lu/wp-content/ql-cache/quicklatex.com-c195b3a96aa05f1240840b2e5a6976d0_l3.png "Rendered by QuickLaTeX.com")
![\frac{\mathrm{d}}{\mathrm{d}x}[\ln(u)] = \frac{u'}{u}](https://mathematics.lu/wp-content/ql-cache/quicklatex.com-0382725f5aa81b9bea8e1f30510ea81a_l3.png "Rendered by QuickLaTeX.com") ):
):![\[f'(x) = \frac{3}{3x + 9} = \frac{1}{x + 3}\]](https://mathematics.lu/wp-content/ql-cache/quicklatex.com-4b25d3e815fcf5f159a7b73444796b88_l3.png "Rendered by QuickLaTeX.com")
 ), the term
  is always positive, meaning
  everywhere. The function is strictly increasing with no extreme points. Calculating the second derivative gives:
![\[f''(x) = \frac{-1}{(x + 3)^2}\]](https://mathematics.lu/wp-content/ql-cache/quicklatex.com-a0307356088d0c0544347a0412831b10_l3.png "Rendered by QuickLaTeX.com")
 for all valid domain inputs,
  everywhere. The graph is strictly concave down with no inflection points.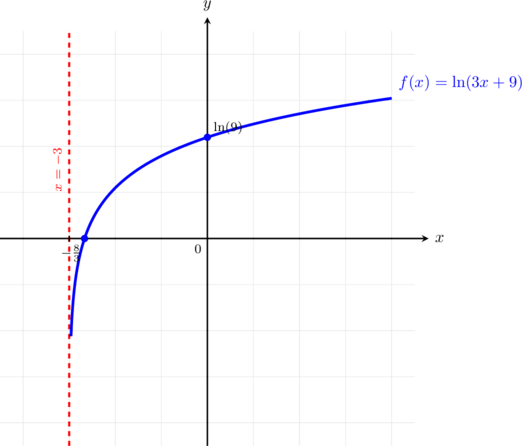
As you can see, logarithmic functions of the form  are not too difficult to sketch. They are monotonic and their asymptotes are easy to understand. If we want to push our luck, we could take a rational function.
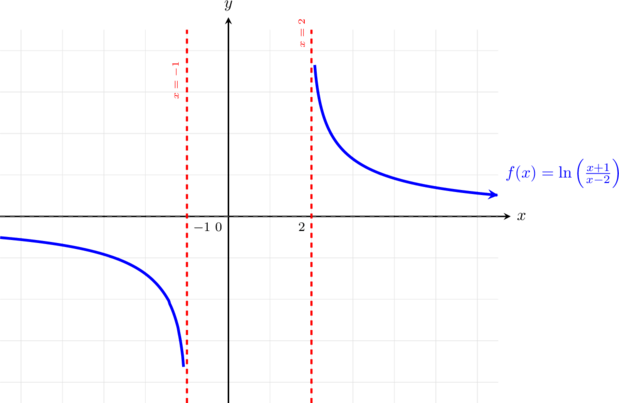
Example: Conduct a complete curve sketching analysis for the function 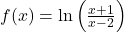 . Identify its domain, axes intercepts, horizontal and vertical asymptotes, local extreme points, and points of inflection and draw a sketch of the curve.
 ):
):
![\[\frac{x+1}{x-2} > 0\]](https://mathematics.lu/wp-content/ql-cache/quicklatex.com-9344ce79bd781c2869920eecdf8bbdc7_l3.png "Rendered by QuickLaTeX.com")
 and
and ![\[\text{Domain: } (-\infty, -1) \cup (2, \infty)\]](https://mathematics.lu/wp-content/ql-cache/quicklatex.com-1c9fe3593710e5d34b14796a2d37c3cd_l3.png "Rendered by QuickLaTeX.com")
 , which is completely undefined. The graph has no
  lies outside the allowed domain.
![\[\ln\left(\frac{x+1}{x-2}\right) = 0 \implies \frac{x+1}{x-2} = e^0 \implies \frac{x+1}{x-2} = 1\]](https://mathematics.lu/wp-content/ql-cache/quicklatex.com-2bc86c0a61e599bb505b99144876d780_l3.png "Rendered by QuickLaTeX.com")
![\[x + 1 = x - 2 \implies 1 = -2 \quad \text{(No Real Solution)}\]](https://mathematics.lu/wp-content/ql-cache/quicklatex.com-0899dfc44fe73fcd7c369837796f2f88_l3.png "Rendered by QuickLaTeX.com")
 : The argument approaches
  .
. .
. :
:
![\[\lim_{x \to \pm\infty} \left(\frac{x+1}{x-2}\right) = \lim_{x \to \pm\infty} \left(\frac{1 + \frac{1}{x}}{1 - \frac{2}{x}}\right) = 1\]](https://mathematics.lu/wp-content/ql-cache/quicklatex.com-aae4896a26b4a7d589f4f63b494ed256_l3.png "Rendered by QuickLaTeX.com")
![\[\lim_{x \to \pm\infty} \ln\left(\frac{x+1}{x-2}\right) = \ln(1) = 0\]](https://mathematics.lu/wp-content/ql-cache/quicklatex.com-6c5537669588ff35643f877b45401f42_l3.png "Rendered by QuickLaTeX.com")
 to simplify calculation:
![\[f'(x) = \frac{1}{x+1} - \frac{1}{x-2} = \frac{(x-2) - (x+1)}{(x+1)(x-2)} = \frac{-3}{(x+1)(x-2)}\]](https://mathematics.lu/wp-content/ql-cache/quicklatex.com-c01f0d1cba49dc0c9f7cf6f2131fc28e_l3.png "Rendered by QuickLaTeX.com")
 yields no solution. Over the allowed domain intervals, the factors
  and
and  always share matching signs, forcing their product to be strictly positive. Due to the negative numerator, the derivative is strictly negative (
 ) everywhere it is defined:

 because
  and differentiate using the power chain rule:
![\[f''(x) = -3 \cdot (-1)(x^2 - x - 2)^{-2} \cdot (2x - 1) = \frac{3(2x - 1)}{(x+1)^2(x-2)^2}\]](https://mathematics.lu/wp-content/ql-cache/quicklatex.com-f4c09cfaaa1351fcaafc85235f32128c_l3.png "Rendered by QuickLaTeX.com")
 . However, this root falls completely inside the excluded domain gap region where the function does not exist. The squared factors in the denominator are strictly positive where defined, so the curvature sign transitions track along the linear numerator factor
  :
:

 and strictly concave up (convex) on
  . Because the mathematical curvature transition occurs across an undefined domain gap, there are no points of inflection.
Sketching an Exponential Function
This is no different from the logarithmic case. In most cases the exponential function should be relatively easy, as a function of the form  is defined everywhere, so domain and asymptotes should also be easy. Since it is always monotonic, there will be no extreme points. Let us see a slightly more interesting example, even if it may go beyond the scope of the programme.
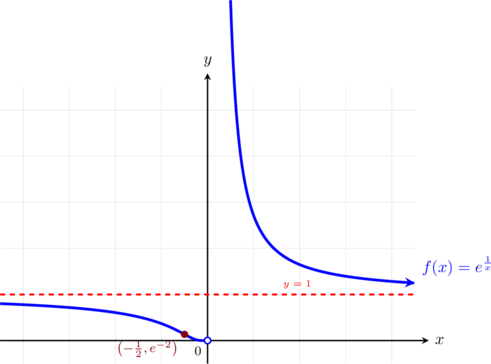
Example: Conduct a complete analysis for the exponential function  . Identify its domain, axes intercepts, horizontal and vertical asymptotes, local extreme points, and points of inflection. Draw a sketch of the curve.
 breaks down when its denominator vanishes at zero.
![\[\text{Domain: } \mathbb{R} \setminus \{0\} \text{ or } (-\infty, 0) \cup (0, \infty)\]](https://mathematics.lu/wp-content/ql-cache/quicklatex.com-01e265a182ba382f7c03699e75194240_l3.png "Rendered by QuickLaTeX.com")
 so there is no
  , which has no real solutions because exponential outputs are strictly positive (
 ). The graph has no
  ): The exponent drives to infinity (
 ), which forces the output to expand:
![\[\lim_{x \to 0^+} e^{\frac{1}{x}} = \infty\]](https://mathematics.lu/wp-content/ql-cache/quicklatex.com-90281cf7ebc5fb7e847fa08e939fdc42_l3.png "Rendered by QuickLaTeX.com")
 ): The exponent decays to negative infinity (
 ), which creates a finite terminal point:
![\[\lim_{x \to 0^-} e^{\frac{1}{x}} = e^{-\infty} = 0\]](https://mathematics.lu/wp-content/ql-cache/quicklatex.com-6ab36c82779314a5027c4992a4d3be65_l3.png "Rendered by QuickLaTeX.com")
 (the
(the ![\[\lim_{x \to \pm\infty} \frac{1}{x} = 0 \implies \lim_{x \to \pm\infty} e^{\frac{1}{x}} = e^0 = 1\]](https://mathematics.lu/wp-content/ql-cache/quicklatex.com-f65cbe4072b8b12ab37e3c7ec3c1ea25_l3.png "Rendered by QuickLaTeX.com")
 .
.
![\frac{\mathrm{d}}{\mathrm{d}x}[e^u] = u' \cdot e^u](https://mathematics.lu/wp-content/ql-cache/quicklatex.com-54d01cf6fb8b421adbf638bdb0c69b6c_l3.png "Rendered by QuickLaTeX.com") ) to calculate the first derivative:
) to calculate the first derivative:
![\[f'(x) = \left(-\frac{1}{x^2}\right)e^{\frac{1}{x}} = -\frac{e^{\frac{1}{x}}}{x^2}\]](https://mathematics.lu/wp-content/ql-cache/quicklatex.com-d0b56f7461884608a671670fda405cd1_l3.png "Rendered by QuickLaTeX.com")
 yields no real solutions. Because
  and
and  for all valid values in the domain, the leading negative sign dictates that the derivative remains strictly negative (
 because
  using the product rule (
 ):
):
![\[f''(x) = \left(2x^{-3}\right)e^{\frac{1}{x}} + \left(-x^{-2}\right)\left(-x^{-2}e^{\frac{1}{x}}\right) = \frac{2}{x^3}e^{\frac{1}{x}} + \frac{1}{x^4}e^{\frac{1}{x}} = \frac{e^{\frac{1}{x}}(2x + 1)}{x^4}\]](https://mathematics.lu/wp-content/ql-cache/quicklatex.com-1bbab975da4fefd67dda06348940ac3b_l3.png "Rendered by QuickLaTeX.com")
 . Since
  where defined, the algebraic sign transitions follow the linear numerator term
  :
:

 . Evaluating the exact matching point height yields:
![\[f\left(-\frac{1}{2}\right) = e^{\frac{1}{-1/2}} = e^{-2} = \frac{1}{e^2} \approx 0.135\]](https://mathematics.lu/wp-content/ql-cache/quicklatex.com-ecab876175ce8c8bb5847a1dfbb72626_l3.png "Rendered by QuickLaTeX.com")
 .
.
Exercises
For each of the following functions, sketch their graphs. Your solutions should explicitly determine: domain restrictions, axes intercepts, equations of vertical and horizontal asymptotes, local extreme points, and points of inflection.